Note: Video demonstration at bottom of post.
In some applications, like Power BI, you can get a distinct count of unique values in a column in just a click or two. But of all the functions in Excel, there isn’t a straightforward “Distinct Count” unfortunately.
There are, however, the following two functions that, when used together, give the desired result:
- COUNTA – Counts the number of cells in a range that are not empty
- UNIQUE – Returns the unique values from a range or array
So, we’re listing all the unique values we have in a range or column by using UNIQUE and then nesting it within the COUNTA function to count the number of values returned. Here are three examples:

| Distinct count goal | Formula example |
|---|---|
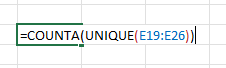
| Distinct count for a range of cells | =COUNTA(UNIQUE(E19:E26)) |
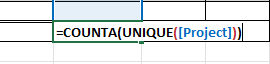
| Distinct count for a table column when referenced within the same table | =COUNTA(UNIQUE([Project])) |
| Distinct count for a table column when referenced outside the table | =COUNTA(UNIQUE(Table1[Project])) |
Be sure to replace the cell range, column name, and/or table and column name in the formulas with your own.
A video demonstration of this formula in use is embedded below.
Leave a Reply