Intro to the ‘Visualize the list’ Power BI feature for SharePoint lists (Recording from Baltimore SharePoint User Group)

I had the honor of presenting one of my favorite Microsoft 365 features for the Baltimore SharePoint User Group’s regular meeting last week. You may have seen this particular feature on your lists (individual or in SharePoint): the ability to visualize a list or library’s data using the Power BI service.

Visualize the list menu option for lists and libraries | Click to enlarge

This newer feature of convenient Power BI integration for lists gives you an automatic report based on your list’s data. We explored how to create a report, customize it, and save it back to the list for future one-click access.

Automatically generated report | Click to enlarge

Even if you haven’t used Power BI (yet), this presentation was made for all experience levels and will provide a proper introduction. In this one-hour session, I specifically covered:

  • How to create an automatic report/dashboard from your list in just a few clicks
  • How to edit and publish the auto-generated report for others to use
  • Site lists vs my lists
  • Limitations of the feature
  • Licensing requirements

Watch the recording on YouTube, or embedded below.

Additional resources

Solution: Power BI report pages not showing up as options for SharePoint web part

If you’ve just copied your multi-page Power BI report’s URL and pasted into the properties of a Power BI web part on a SharePoint page, you may have noticed your pages aren’t appearing as options in the Page name dropdown.

Click to enlage

This is because the URL you copied from Power BI likely contained a specific page in the URL itself, ending in something like …/ReportSection1 (which is referring to a specific page already).

To fix this and have your pages show up as options in the dropdown, simply remove the ReportSection1 (or 2, 3, etc.) from the end of the URL in the Power BI report link box and try again.

To speed things along, I usually cut (Ctrl+X) the corrected URL, click outside the box to “reset” the web part, then paste (Ctrl+V) the corrected URL and wait for my page names to appear. This is demonstrated below.

Click to enlarge

Here’s a related video demonstrating how to embed a Power BI report on a SharePoint page including fixing the multi-page issue mentioned above.

Restrict who can install on-premises data gateways for the Power Platform

Data gateways allow users to connect online services, such as Power BI service, Power Automate, and Power Apps to on-prem data sources such as SQL databases, SharePoint server lists and libraries, and network shares.

As you can imagine, you wouldn’t want everyone installing their own individual gateways throughout your organization. Managing and sharing those centrally is much more efficient (and secure). You can manage who is allowed via the Power Platform admin center at admin.powerplatform.microsoft.com.

Note: You must be one of these roles to restrict gateway installers:

  • Azure AD Global administrator
  • Office 365 Global admin
  • Power BI service administrator

Restricting installations does not impact gateway administration. You can assign and re-assign users to administer and use gateways at any time. The following steps are strictly to manage who is able to install an enterprise gateway on a machine.

1. Go to the Power Platform admin center

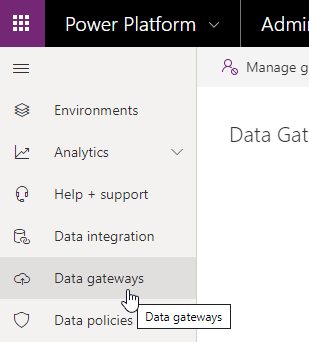
2. Click “Data gateways”

3. Click “Manage gateway installers”

4. Toggle “On” the Restrict users in your organization from installing gateways

Click to enlarge

5. Add authorized users.

In just a few clicks, you’ve enabled better management of enterprise access to on-premises data sources for scheduled data refreshes, apps, and flows.

Click to enlarge

Connect a Google Sheet spreadsheet to Power BI as a data source

Update 9/29/21: A new Google Sheets connector is coming soon for Power BI. Keep an eye out for updates.

I recently connected Power BI directly to a spreadsheet in Google’s Excel alternative, Google Sheets. It’s important to connect to data without moving it when we can. The less we have to export/download, save, rename, move, massage, etc. the better.

Here’s how we’ll connect to a Google Sheet:

  1. Get “no sign-in required”/anonymous share URL from Google Docs
  2. Adjust URL for Power BI
  3. Connect to “Web” data source in Power BI, using adjusted URL

Get anonymous share link from Google Docs

To get started, open your Google doc/sheet and click “Share.” If you don’t see “anyone (no sign-in required)” or something similar, click “More.” Then select “On – Anyone with the Link.” Copy the resulting URL.

Adjust URL for Power BI

  1. Paste the URL into Notepad, or a similar, simple text editor.
  2. Remove /edit?usp=sharing from the URL and add /export?format=xlsx&id= in its place
  3. Copy the ID between /d/ and /export… (see red box below)
  4. Paste the ID at the end of the URL (see green box below)
Click to enlarge

Connect to Google Sheet in Power BI

1. Get Data > Web

2. Paste your adjusted URL and click OK.

As long as you used the correct Google Sheet share link (anyone with the link can view), you’ll see your data ready to load or transform as usual in the Navigator screen. If you get an error, double-check the share link type.

Acknowledgment

Thanks to GGetty at this thread for pointing me in the right direction. Note one of the comments from 2017 warning you may need to be owner of a file (having edit rights may not be sufficient) doesn’t seem to be true anymore. I successfully connected to a file I only had edit rights to.

Add or subtract hours from date/time values in Power BI using M formula in Power Query Editor

Previously, I shared how to transform date/time values in Power BI using DAX. But I’m working on building more using M formulas as those are less resource-intensive and improve report performance.

The following was my solution for correcting a time zone issue in which the original data’s date/time column was 5 hours ahead.

=[#"Date/Time"] - #duration(0, 5, 0, 0)

That example subtracts 5 hours from a column called Date/Time. You can change the column name to your own, of course. Also update the numeric values in the #duration part to add or subtract days, hours, minutes, and seconds, respectively.

#duration(days, hours, minutes, seconds)

And just change the to + to add instead of subtract.

Examples

Add seven days (a week)

=[#"Date/Time"] + #duration(7, 0, 0, 0)

Correct a time zone – Add hours

=[#"Date/Time"] + #duration(0, 5, 0, 0)

Correct a time zone – Subtract hours and minutes

=[#"Date/Time"] - #duration(0, 2, 30, 0)

Learn more about M formulas and functions

Check out “Add a custom column in Power BI Desktop” from Microsoft Docs to get started with creating custom columns using M formulas instead of DAX.

This Power Query M function reference guide is super helpful for learning more about available functions to use in your M formulas in Power Query Editor.

Power BI refresh error “could not load file or assembly…provided impersonation level is invalid”

Short version

Run Power BI Desktop as administrator before opening the report.

Explanation/Scenario

Recently, when opening a report from Power BI Report Server that used a SQL database as a data source I received the following error.

An error happened while reading data from the provider: ‘Could not load file or assembly ‘System.EnterpriseServices, Version=4.0.0.0, Culture=neutral,PublicKeyToken=b03f5f7f11d50a3a’ or one of its dependencies. Either a required impersonation level was not provided, or the provided impersonation level is invalid. (Exception from HRESULT: 0X80070542)’

So I clicked “Edit Queries” to see what was going on and received almost the same error but referencing a specific table and getting me thinking about SQL specifically.

Error seen after clicking “Edit Queries”

So I checked that table in the query editor and received yet again the same error.

Error seen after clicking the specific table referenced in the previous error message

Simple solution. It’s likely that your credentials and queries are just fine.

The solution for my particular issue here, and the meaning behind the “impersonation level” part of the error, is just that you need to run Power BI Desktop as administrator before accessing the report. After opening the report in Power BI Desktop being ran as an administrator, everything worked as expected.

“Unable to connect” error when accessing SQL database in Power BI Desktop

When attempting to access a SQL server/database in Power BI, you might get the following error message:

Unable to connect

We encountered an error while trying to connect.

Details: “An error happened while reading data from the provider: ‘Could not load file or assembly ‘System.EnterpriseServices, Version=4.0.0.0, Culture=neutral, PublicKeyToken=…..

Error message received when trying to get a SQL database as a data source in Power BI

Solution

You just need to run Power BI as administrator before attempting to access the SQL database as a data source.

  1. Save your work and close Power BI Desktop
  2. Right click Power BI Desktop and select “Run as administrator”

3. Attempt to access your database again – you shouldn’t have an issue.

Solution: “An error occurred while attempting to save the report to Power BI Report Server”

Symptoms

Did you recently download a newer version of Power BI Desktop (optimized for Report Server)? The latest is August 2018 as of the writing of this post. If you’ve downloaded August and are trying to save to an outdated version of Report Server via the client application, it’ll give you this error message.

“An error occurred while attempting to save the report to Power BI Report Server.”

2018-11-27_09-55-22

And you can try going to Power BI Report Server via your browser and uploading there directly, but you’ll get this error message which is more helpful:

“We can’t save this Power BI Desktop report because either it is newer version or has component parts that are not supported.”

chrome_2018-11-27_12-34-14

Cause

This error occurs when users are trying to save a report from a Power BI Desktop version that’s newer than the version of Power BI Report Server installed on your server.

Solution

Upgrade your Power BI Report Server version to the latest available to make sure it’s compatible with users using the latest version of Power BI Desktop available. It will be backwards-compatible in case you have users still on October 2017 or March 2018.

  1. Log in to the server that hosts your Power BI Report Server
  2. Download the latest version of Power BI Report Server
    1. Go to https://powerbi.microsoft.com/en-us/report-server/
    2. Click “Advanced download options”
      chrome_2018-11-27_12-46-35.png
    3. Select your language and click “Download”
      chrome_2018-11-27_12-46-59.png
    4. Check the box next to “PowerBIReportServer.exe” and “Next”
      chrome_2018-11-27_12-47-26.png
  3. Run the downloaded .exe file and click “Upgrade Power BI Report Server”
    mstsc_2018-11-27_10-10-03.png
  4. Follow the prompts, and reboot the server when finished. This will cause a short amount of downtime.

You should now be able to access and save reports from/to the server as usual from all versions of Power BI Desktop.


How to count per-row occurrence of multiple words or phrases across multiple columns in Power BI

Sometimes you want to know how many times words and phrases appear across multiple columns. For example, if we want to know how many times “Cat” OR “Mouse” appears in each row, we would get:

Column 1 Column 2 Column 3 Word Count
Cat Yarn Mouse Cat Dog 3
Dog Cat Horse Hay Dog 1
Cat Cat Cat Mouse 4

Continue reading “How to count per-row occurrence of multiple words or phrases across multiple columns in Power BI”

What is the Related() function in Power BI?

RELATED() pulls values from different tables based on relationships established in the relationships tab. This is useful and makes it so we don’t necessarily need to append or merge tables to get the same result.

For example, we can create a new calculated column in our fact table Sales that pulls in related information from two other tables without needing to append or merge tables:

PBIDesktop_2018-09-25_10-32-08

Continue reading “What is the Related() function in Power BI?”